
Cathodoluminescence collection
Collect electron-beam-induced optical emission for spectral or image-correlated analysis.
Emission spectroscopy
Collect electron- or laser-stimulated emission and compare optical response with SEM/FIB images.
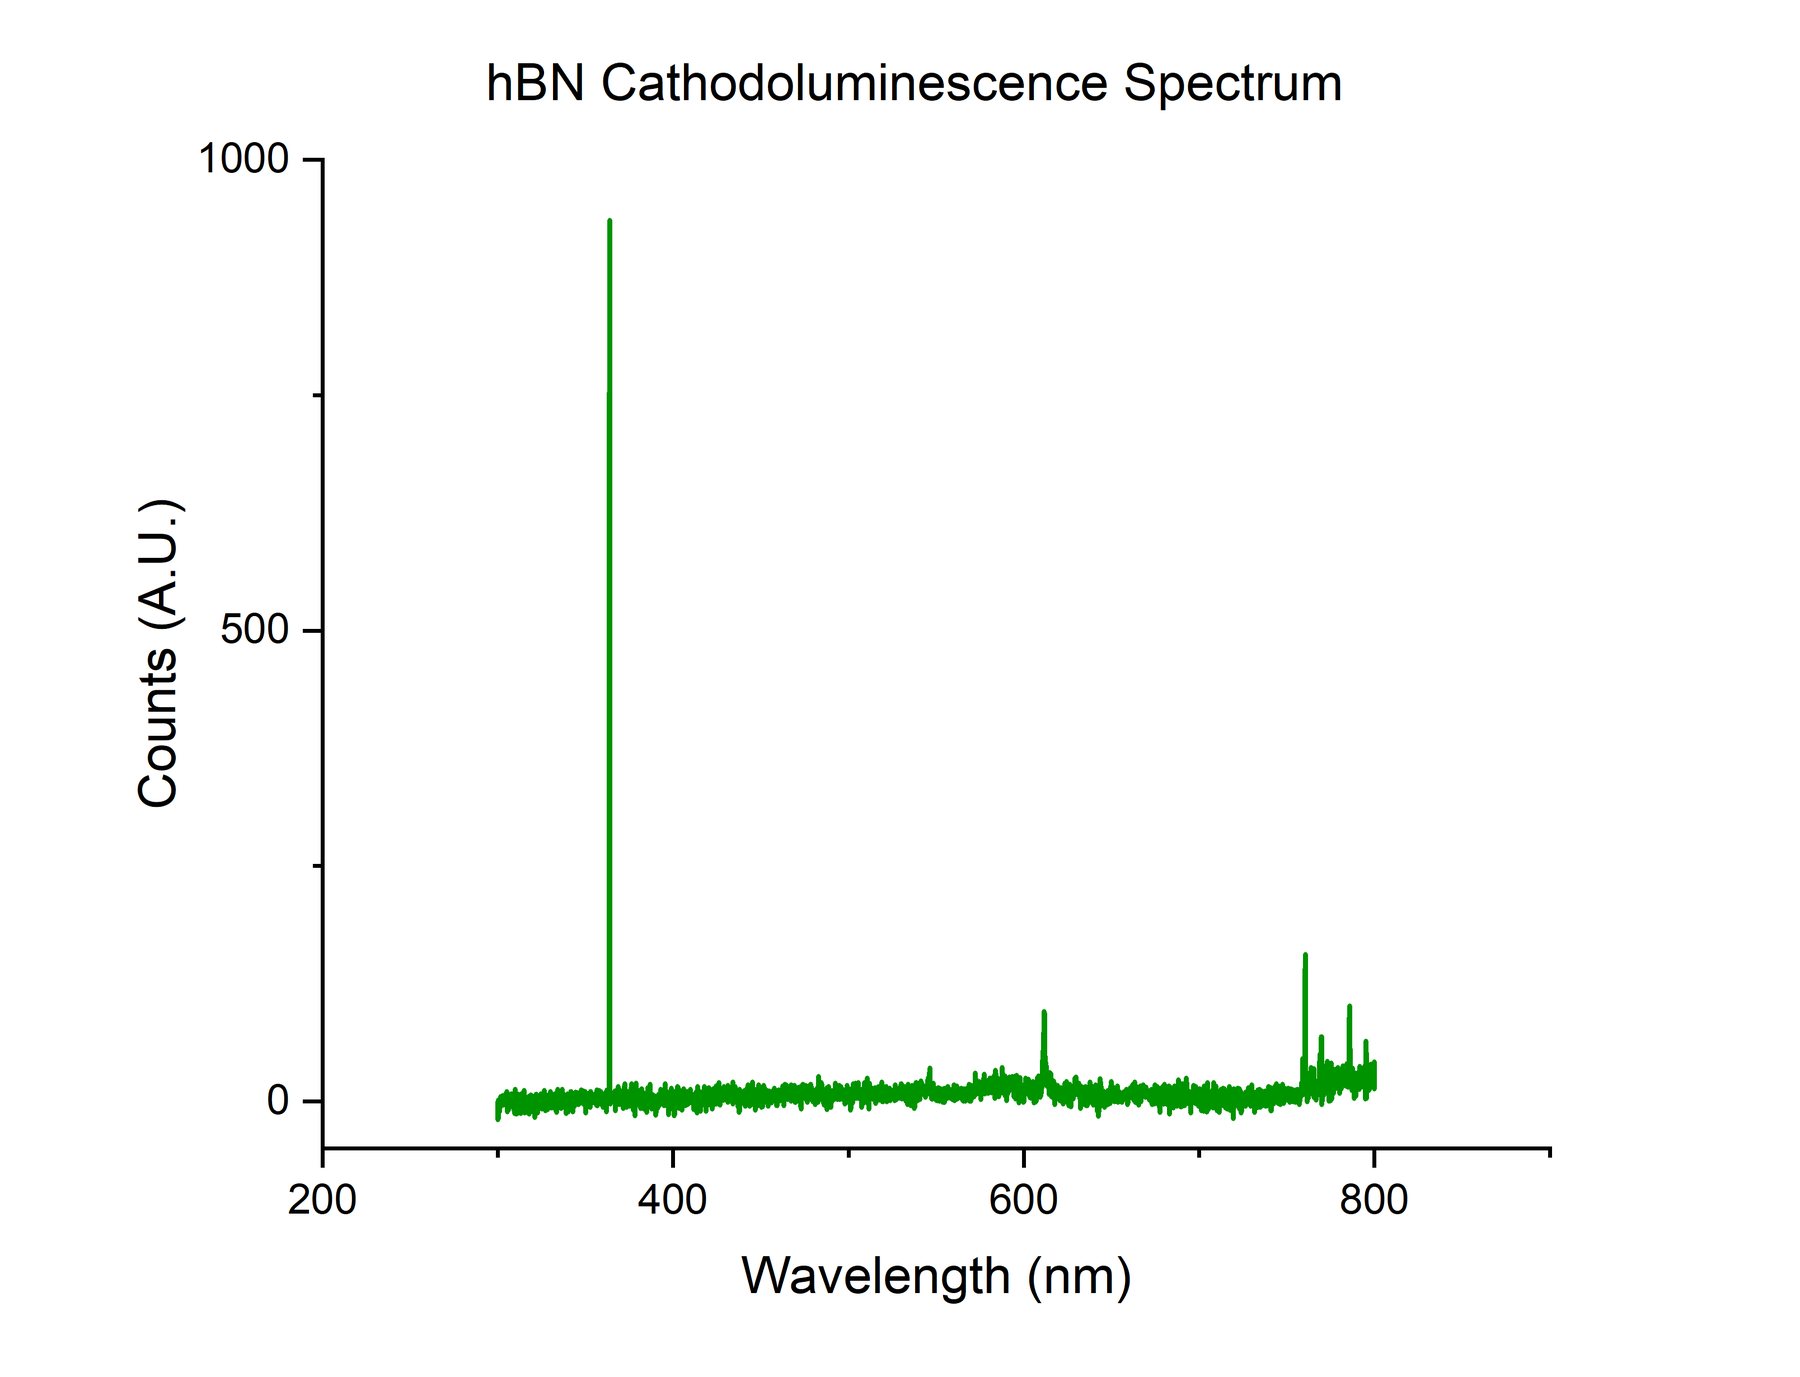
Emission overview
Cathodoluminescence collects light emitted under electron-beam stimulation. Photoluminescence collects light emitted after optical excitation. Waviks CL/PL systems connect those emission paths with SEM/FIB imaging where the microscope and detector path support the measurement.
Capabilities
Final configuration depends on microscope geometry, optical access, detectors, spectrometer configuration, sample type, and experiment goals.
Collect electron-beam-induced optical emission for spectral or image-correlated analysis.
Support optically stimulated emission measurements where laser excitation and sample access are appropriate.
Discuss detector and spectrometer paths around wavelength range, signal levels, and experiment goals.
Use camera-first alignment and optical views to position collection paths and sample regions more repeatably.
Connect optical emission signals with SEM/FIB images, maps, sample conditions, and material features.
Coordinate cameras, spectrometers, illumination, acquisition views, and hardware profiles.
Applications
CL/PL workflows help connect optical response with structure, defects, interfaces, and local microscopy observations.
Correlate optical emission with device structures, growth features, defects, and electron microscopy context.
Investigate emission signatures tied to defect states, recombination pathways, or local material variation.
Support optical response studies where emission behavior benefits from spatially correlated microscopy data.
Explore local emission, layer-dependent response, strain effects, and correlative mapping workflows.
Connect optical performance indicators with morphology, interfaces, and electron/photon measurement context.
Combine photon signals, spectra, maps, and SEM/FIB imaging into a more complete materials picture.
Tell us your microscope, sample, wavelength range, detector needs, and measurement goals. Waviks can help determine the right optical configuration.